How to configure and style Elementor Chart Widget
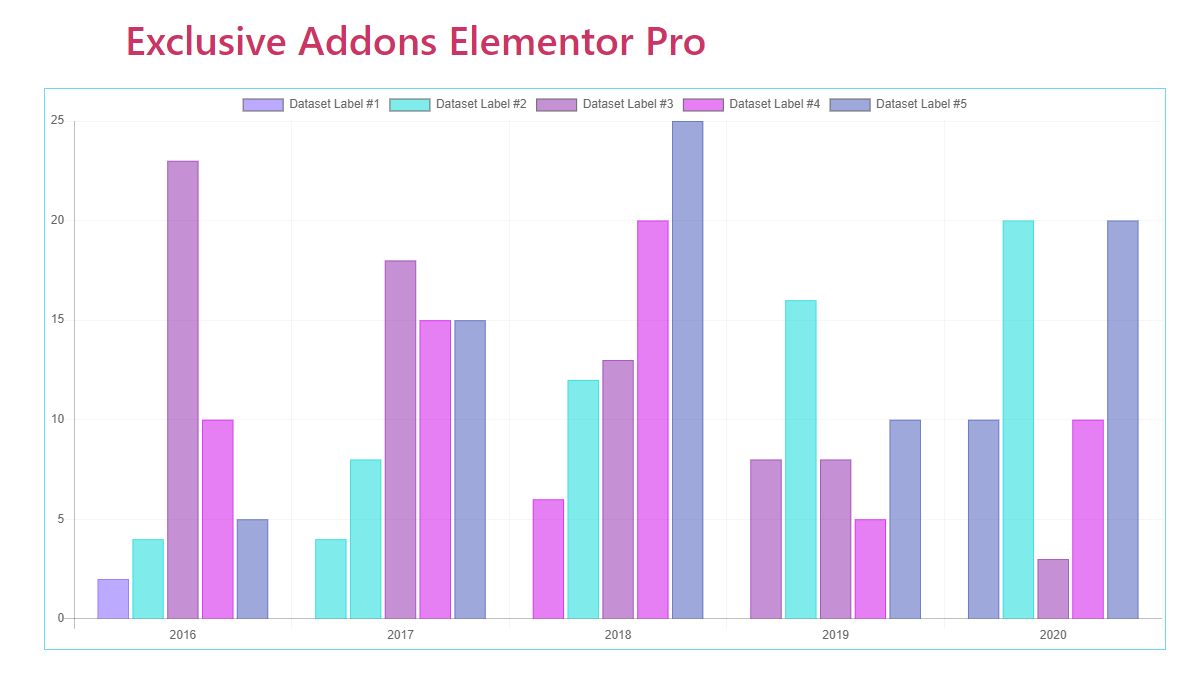
Represent data visually with 5 different styles and loads of customizable options. Add labels, insert and change data easily, using Chart Widget of Exclusive Addons Elementor.
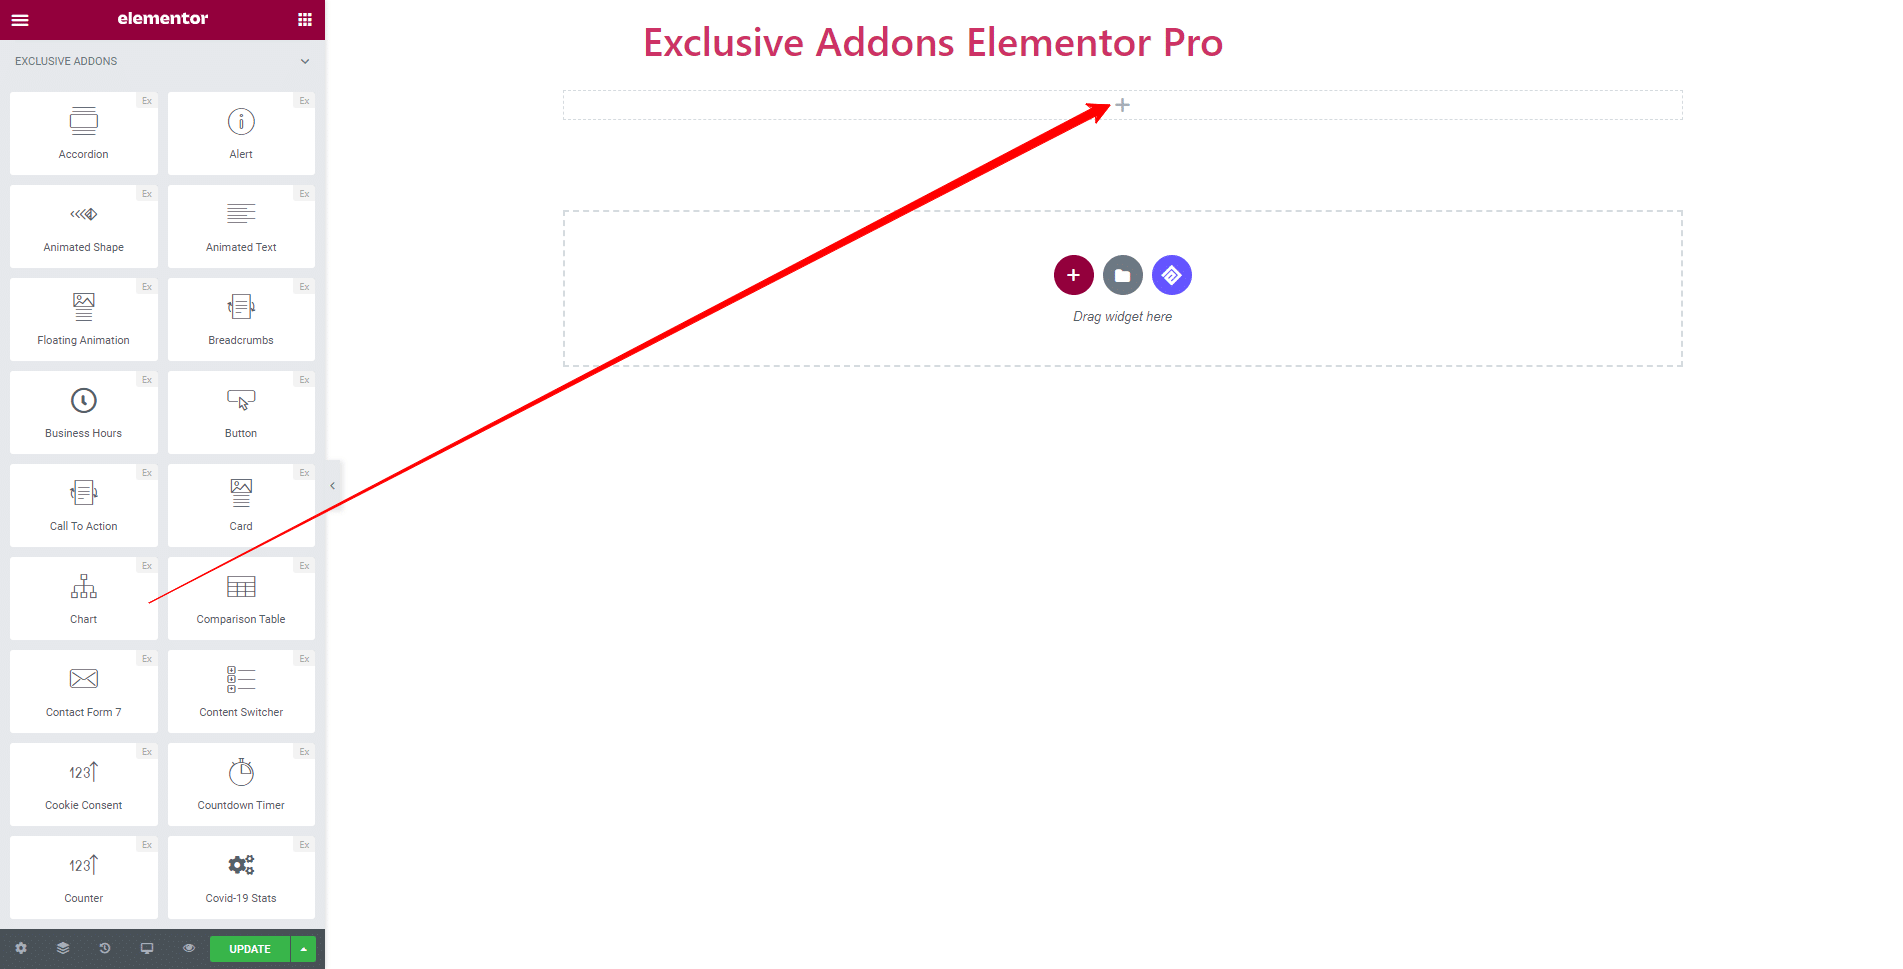
Step-1:
Select the ‘Chart’ widget from Elementor panel. Then drag and drop it in the selected area.
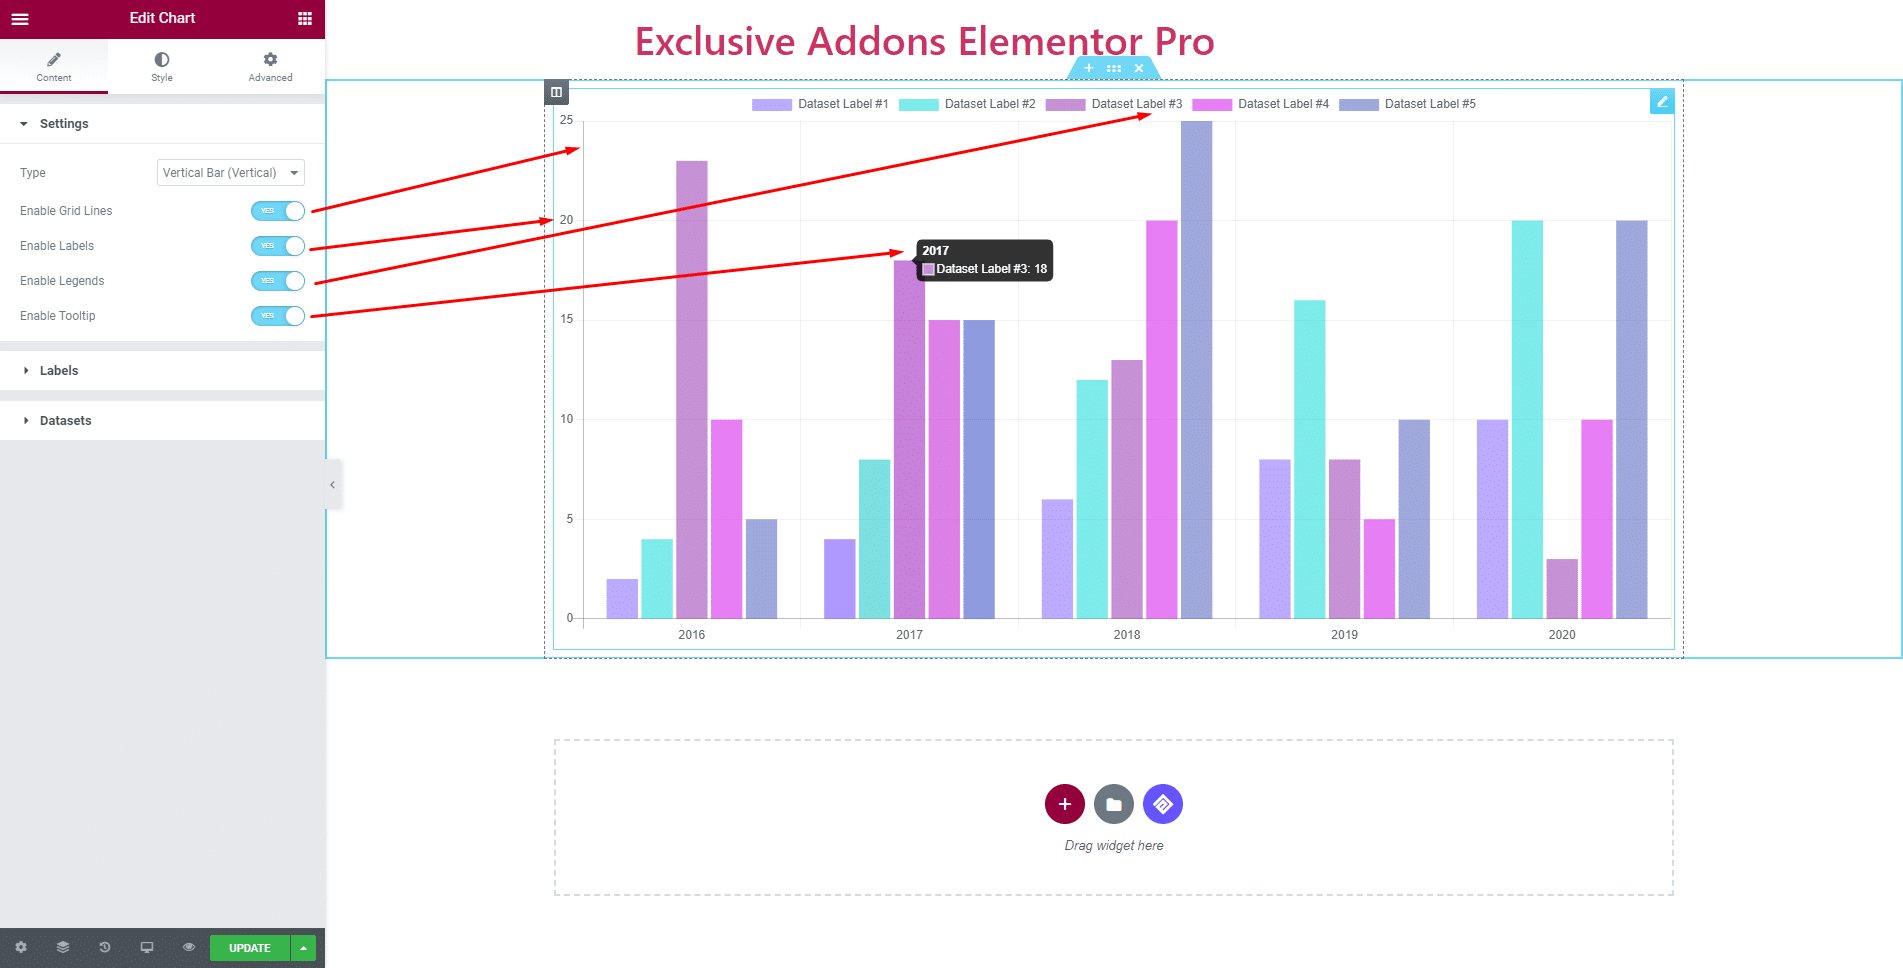
Step-2:
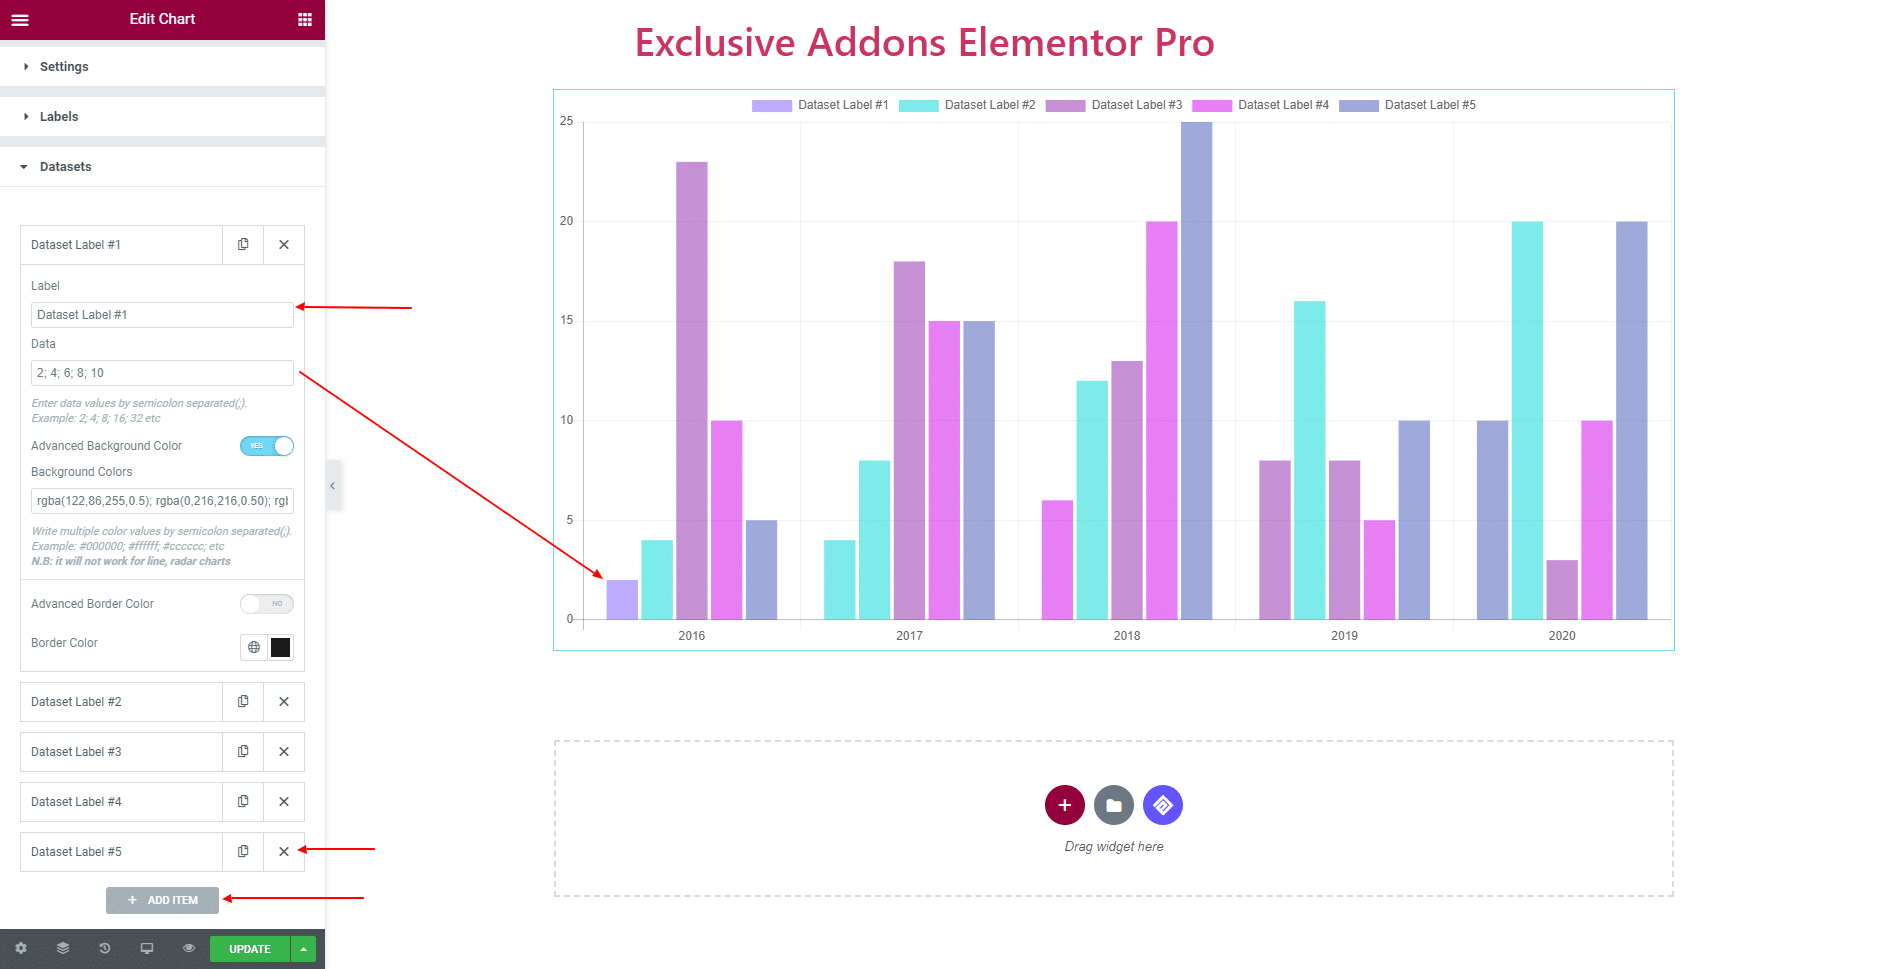
Content tab allows you to configure Settings, Labels, and Datasets section.
2.1. In Settings section, you get to select chart type from 5 different styles.You can Enable Grid Lines, Labels, Legends, and Tooltip as well.
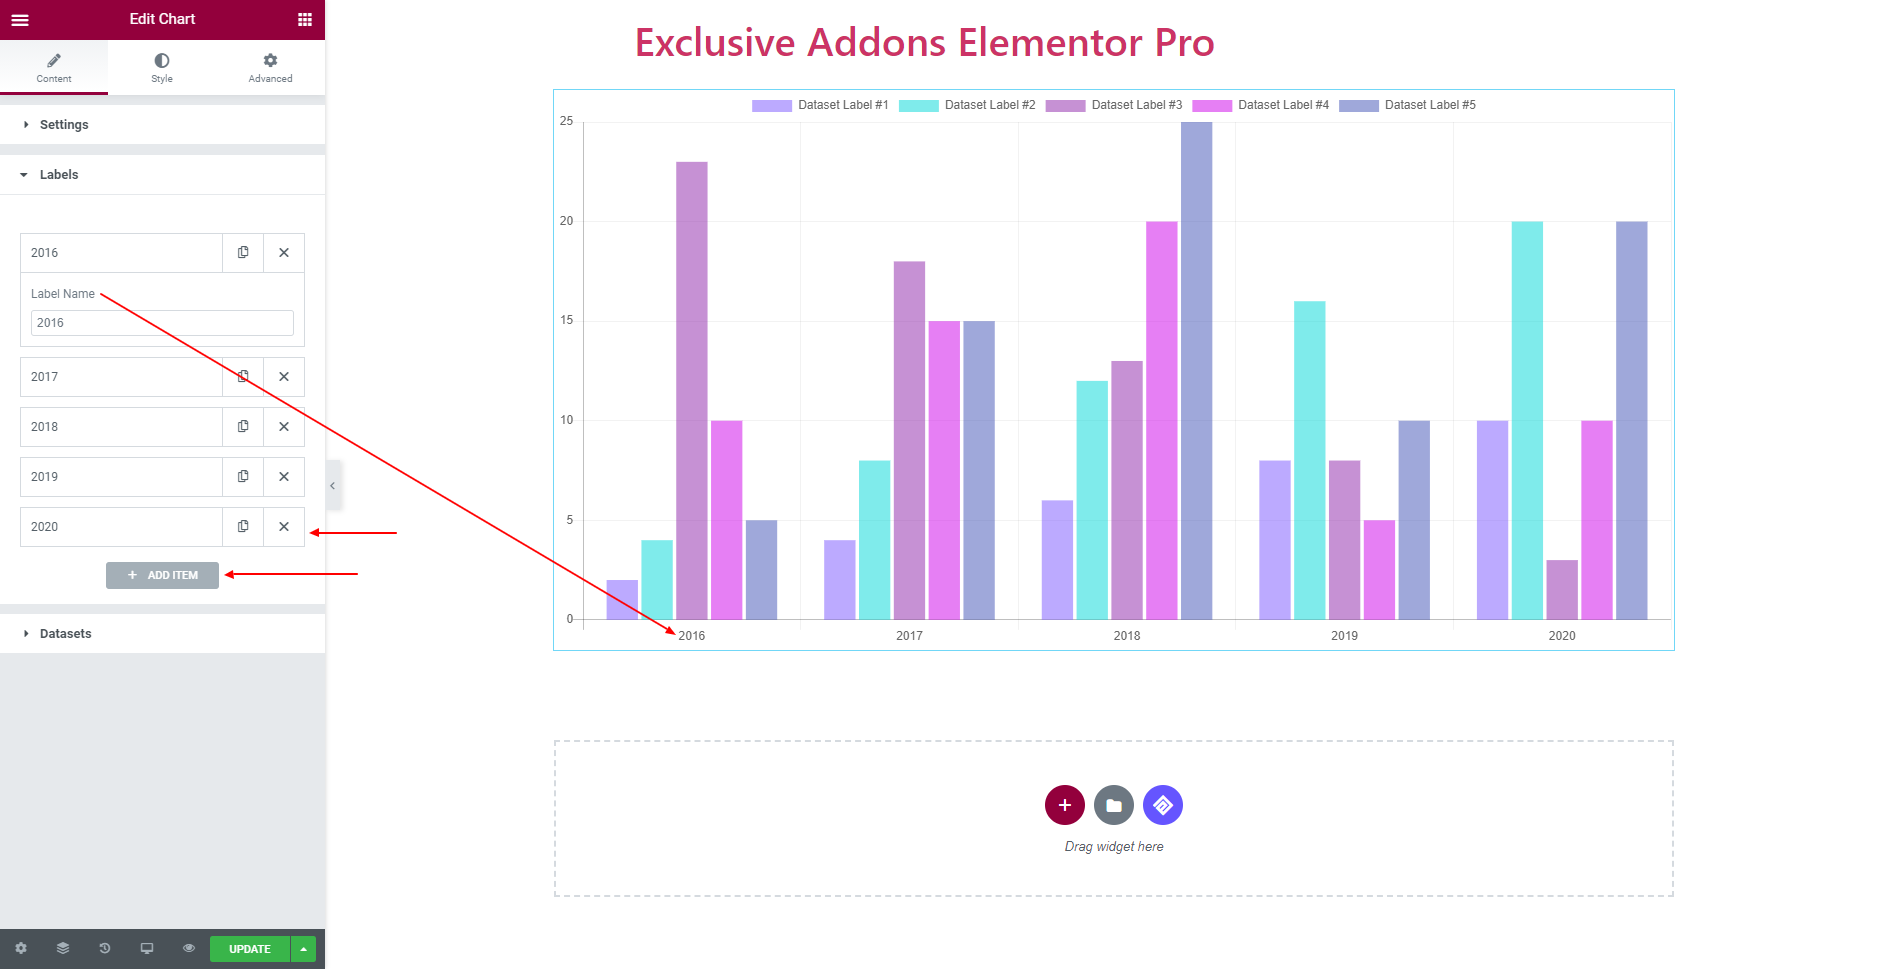
2.2. In Labels section, add as many items as you want, also can delete items simply by clicking ‘Cross’ button. You can change Label Name for each one.
2.3. In Datasets section, hit the ‘Add Items‘ button and add as many items as you want. Also, delete any of the items simply by clicking the ‘Cross‘ button. Set Data for each label. You can enable Advanced Background Color and set RGB value, also can enable Advanced Border Color, and choose Border Color.
Step-3:
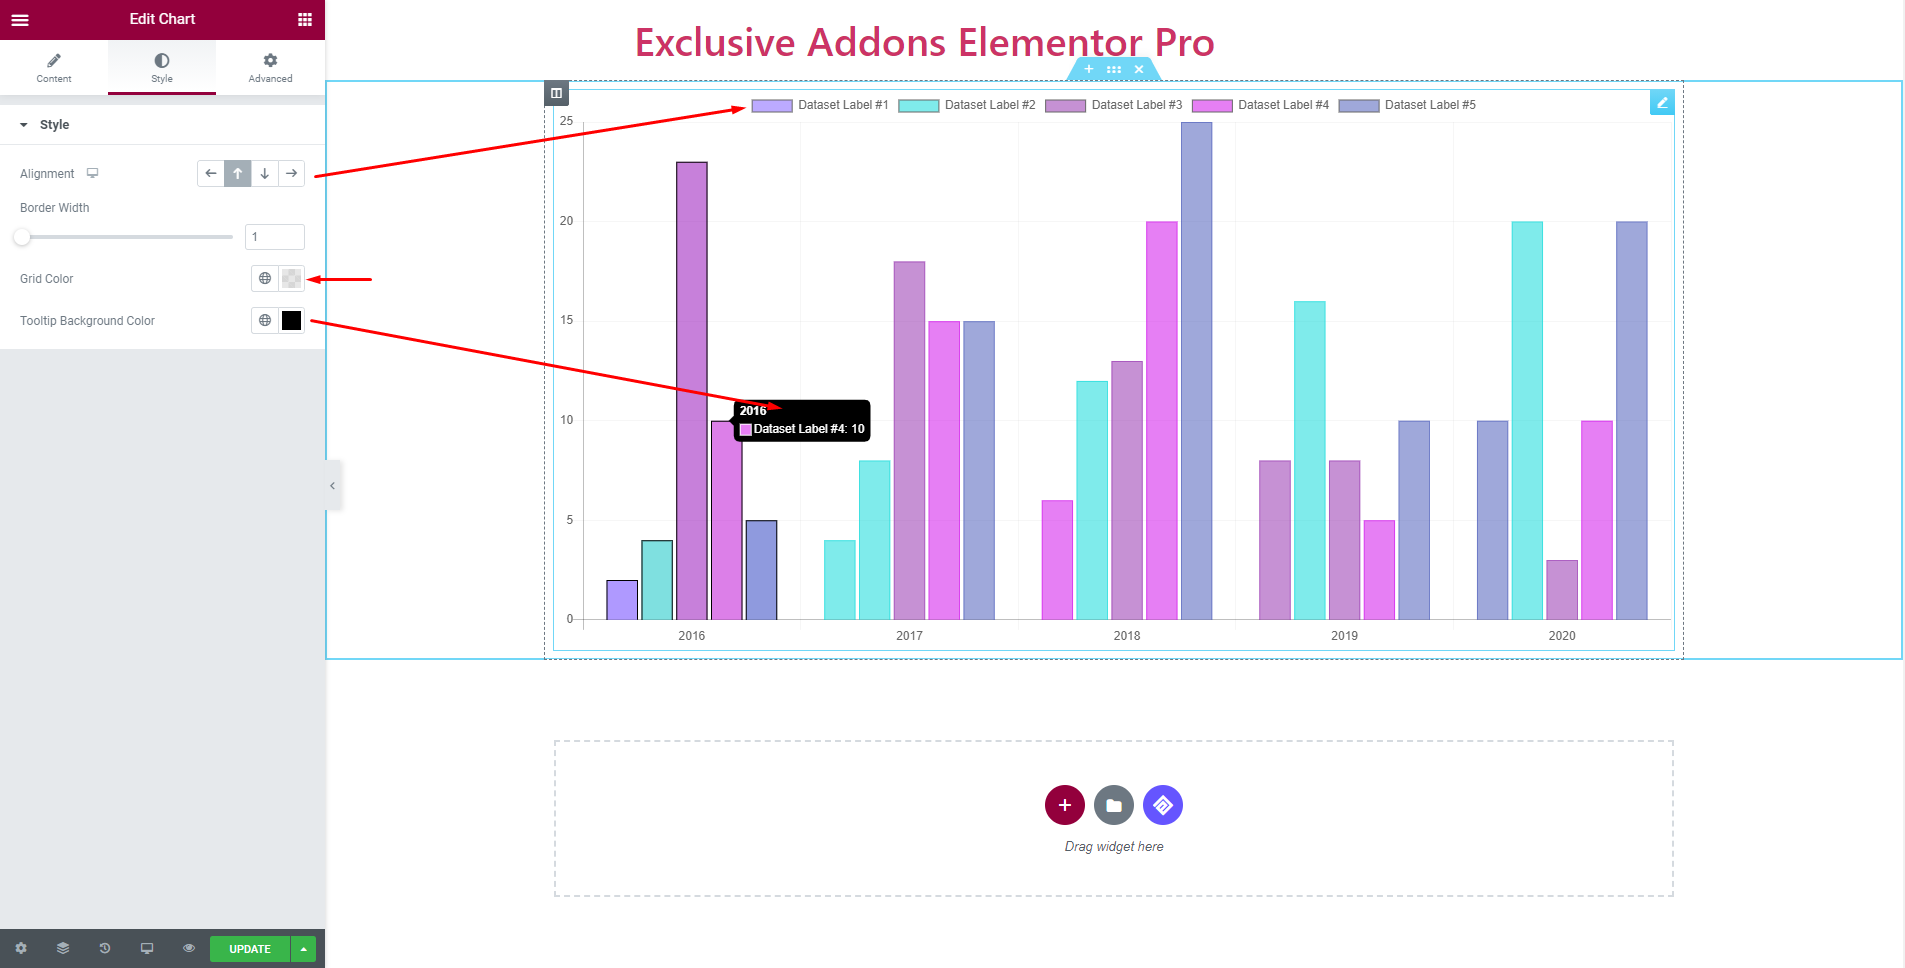
Style allows you to customize the Chart design by changing Alignment, Border Width, Grid Color, and Tooltip Background Color. You can change Legends Position to ‘Top’, ‘Bottom’, ‘Left’ or ‘Right’ by changing its Alignment.
Step-4:
Finally, hit the Update button, and include a stylish Chart widget on your Wordpress site.